Showing posts with label Peter Wadhams. Show all posts

Wednesday, November 14, 2012

Arctic Sea Ice set to collapse in 2015

The image below depicts Arctic sea ice volume as calculated by PIOMAS (the Pan-Arctic Ice Ocean Modeling and Assimilation System at the Polar Science Center

Total Arctic sea ice volume from PIOMAS showing the volume of the mean annual cycle.

Below, the average monthly volume data over the years with exponential trends added by Wipneus, incorporating the data for November 2012. 
In November 2012, the average Arctic sea ice thickness over ice-covered regions fell below one meter, as illustrated by the image below. 
Average Arctic sea ice thickness over the ice-covered regions from PIOMAS for a selection of years.
The average thickness is calculated for the PIOMAS domain by only including locations where ice is thicker than .15 m
As the sea ice gets thinner, the risk increases that the ice will break up. More open water makes the Arctic Ocean more prone to storms and associated feedbacks that can be expected to speed up such break up. Furthermore, they can push much of the ice into the Atlantic Ocean, leaving little ice in the Arctic Ocean to reflect sunlight back into space and to act as a buffer when temperatures start rising again the following year. For more on such feedbacks, see the post Diagram of Doom

Professor Peter Wadhams warns in an article in Scientific American that the rate at which summer melting is outstripping accumulation of new ice in winter makes the entire ice cover likely to collapse by 2015. Less ice means that less sunlight will be reflected back into space; as a result, warming in the Arctic will accelerate dramatically. Because a third of the Arctic Ocean is composed of shallow shelf seas, surface warming will extend to the seabed, melt offshore permafrost and trigger the release of methane, which has a much greater greenhouse warming effect than CO2. A Russian-U.S. expedition led by Igor Semiletov has recently observed more than 200 sites off the coast of Siberia where methane is welling up from the seabed. Atmospheric measurements also show that methane levels are rising, most likely largely from Arctic emissions. To avoid the consequences of a collapse of summer ice, we need to bring back the ice we have lost. That will require more than merely slowing the pace of warming—we need to reverse it, Professor Wadhams adds. 

Tuesday, October 16, 2012

Albedo change in the Arctic threatens to cause runaway global warming

Mark Flanner et al. calculated in 2011 that snow and ice on the Northern Hemisphere had a combined cooling effect of 3.3 Watts per square meter (of which 2 W/m² relates to the snow cover on land and 1.3 W/m² to the sea ice).

This cooling effect is diminishing rapidly, as temperatures rise and snow and ice cover declines. Snow and ice on the Northern Hemisphere had already declined substantially over the years and was reflecting 0.45 watts less energy per square meter in 2011 than it did in 1979 (Flanner, 2011).

As discussed in Albedo change in the Arctic, Professor Peter Wadhams calculates that the loss of the Arctic sea ice cooling effect alone can be compared to the net global warming caused by people's emissions (1.66 W/m², IPCC, 2007b).
From: sites.google.com/site/arctischepinguin/home/piomas

The exponential trends added by Wipneus to PIOMAS Arctic sea ice volume data show that the Arctic Ocean looks set to be ice-free from 2015 onwards for the period from August through to October, while July and November look set to follow from 2017, respectively 2018 onwards with June following closely thereafter. In other words, we could soon face an Arctic Ocean that is ice-free for half the year.

Snow cover on land takes up an even larger area than sea ice. The chart below illustrates the decline of snow cover on land in the Northern Hemisphere (without Greenland) for the month June.


What trends could fit these data? On the image below, I've added trendlines and I encourage others to come up with better ones.

Clearly, a lot of snow and ice looks set to disappear over the next few years. Note that what happens in winter doesn't matter as much, as little sunlight reaches the Arctic in winter. What matters most is how much sunlight is reflected when insolation in the Arctic is high. Insolation during the months June and July is higher in the Arctic than anywhere else on Earth, as shown on the image below, by Pidwirny (2006).


While Greenland remains extensively covered with snow and ice, the reflectivity of its cover shows rapid decline, as illustrated by the image below. The July data since 2000, from the meltfactor blog with projection in red added by Sam Carana, suggest a exponential fall in reflectivity that looks set to go into freefall next year.
From: Greenland is melting at incredible rate

Albedo: wikipedia.org/wiki/Albedo

A drop of as little as 1% in Earth’s albedo corresponds with a warming roughly equal to the effect of doubling the amount of carbon dioxide in the atmosphere, which would cause Earth to retain an additional 3.4 watts of energy for every square meter of surface area (NASA, 2005; Flanner et al., 2011).

Combined, the snow line retreat, loss of sea ice and decline of Greenland's reflectivity constitute a huge loss of summer cooling in the Arctic.

As a result, summer temperatures in the Arctic look set to rise rapidly over the next few years, threatening to unleash massive amounts of methane from sediments below shallow waters of the Arctic Ocean, spiraling Earth into runaway global warming.

If you are also concerned about this development, please share the image below at Facebook, with a link to this post.


References

- Albedo - Wikipedia
wikipedia.org/wiki/Albedo

- Albedo change in the Arctic
arctic-news.blogspot.com/2012/07/albedo-change-in-arctic.html

- Flanner et al. (2011), Radiative forcing and albedo feedback from the Northern Hemisphere cryosphere between 1979 and 2008.
nature.com/ngeo/journal/v4/n3/full/ngeo1062.html

- Flanner et al. (2011), Presentation October 27, 2011, WCRP Open Science Conference
wcrp-climate.org/conference2011/orals/B11/Flanner_B11.pdf

- Greenland is melting at incredible rate
arctic-news.blogspot.com/2012/07/greenland-is-melting-at-incredible-rate.html

- NASA, 2005 (at Archive.org)
archive.org/details/albedo_ceres_mar05

Pidwirny, M. (2006). "Earth-Sun Relationships and Insolation". Fundamentals of Physical Geography, 2nd Edition
physicalgeography.net/fundamentals/6i.html

- PIOMAS monthly average sea ice volume, with exponential trends added
sites.google.com/site/arctischepinguin/home/piomas

- Snow Climate Lab, Rutgers University
climate.rutgers.edu/snowcover


Wednesday, October 10, 2012

Saving the Arctic Ice (#1)

By Nathan Currier

Greenpeace, Greenwashing and Geoengineering

Nathan Currier, senior climate advisor for Public Policy Virginia

There was much media attention a couple of weeks ago when this year's sea ice extent minimum broke all records: it was down almost 50 percent from the 1979-2000 average. Little attention, though, accompanied a possibly even more significant figure, released a few days ago: those who run the PIOMAS sea ice volume model at the Polar Research Centershowed the 2012 sea ice volume minimum was down almost 50 percent not from decades ago -- but from 2007! That's right: the volume of arctic sea ice this September minimum was probably about half of what it was, just back in 2007. This figure should deeply trouble any reasonable human being, as it strongly suggests reaching an ice-free arctic sea ice minimum within half a decade, and, since there is little dispute that some summer sea ice will persist to the north and west of Greenland for much longer, the first "near-ice-free" point will likely arrive in just the next few years, as sea ice expert Peter Wadhams has pointed out, and the London-based policy group and think tank Ameg has maintained.

How should we respond? Greenpeace recently started a "Save the Arctic" campaign. That's great -- but you can only save the arctic by saving its ice. And, unfortunately, it is now clear that this can no longer be achieved through emissions reductions alone. It's too late for that. Greenpeace held ameeting on the polar emergency in New York City, by chance on the same day the record extent minimum was called, and while on the surface it seemed pretty ordinary, it was at heart very odd. Nobody suggested any change of approach, any specific re-strategizing, to respond to the accelerating situation. The word emergency was a common currency passing all lips, but in fact it was unclear whether people were really speaking the same language, especially as concerns that most precious thing in emergencies -- time. And there seemed to be no translator in the room, saying "this is the timescale of this, that's the timescale of that."

The meeting's two scientists, Wieslaw Maslowski (on ice) and James Hansen (general climate), themselves focusing on somewhat different time scales, were followed by the 'social/political' panel discussing what we should do: the panel discussed green energy, solar power, how we shouldn't move towards nuclear, that kind of stuff. But Jim Hansen had said in answer to a question (mine), "We are going to lose that sea ice," and also said that to save it, "You could do some quick things." As I'll discuss in my next post, Hansen meant geoengineering. Greenpeace Director Kumi Naidoo later couldn't even remember the word -- geoengineering. But if he's going to save the arctic, I'm afraid he's going to need to know it.

A big issue in whether to consider something an important 'threshold' is its reversibility, and we will discuss the reversibility of this one further in the next episode. At the meeting, since Maslowski focused on sea ice modeling failures, and Hansen on the whole climate picture, many of the potential immediate physical impacts of allowing this coming ice loss remained poorly or not at all elaborated -- although they are important for Greenpeace, and everyone else, to understand, I feel. Hansen showed a slide of three major tipping points which he said place us in a climate 'emergency,' because one can lose control around tipping points. One was methane hydrate, for example. But what Hansen didn't show were what I might dub the 'minor tipping points,' far more immediate changes stemming from this coming loss, which could make it hard to turn around, and could lead us straight to those more major ones Hansen fears, in a slippery slope.

Keep in mind that what we're talking about here is losing almost as much summer ice cover in just the next few years as we have over the last few decades, and that these are all circularly interrelated reinforcing mechanisms. Sorry, if it seems a bit mind-numbing for some readers, but here's my list:

1. Greatly increased arctic water vapor, increasing arctic warming (water vapor is a potent greenhouse gas) but also fundamentally altering arctic hydrology and hence weather patterns.

2. Immediately and fundamentally altered arctic atmospheric chemistry, causing increased arctic methane lifetime, among other basic changes.

3. Certain increase in acceleration of arctic warming, from increased solar energy entering the arctic ocean (this engenders 1.) and the release of latent heat into the atmosphere during autumn's rapid re-freezing.

4. Consequent increased potential for large arctic storms like the Great Arctic Cyclone this summer.

5. Consequent increased deep convection events (mixing to bottom) of arctic ocean, particularly important over the shallow water of the shelves, where lower layers can now often be methane-saturated.

6. Consequently an increase of seabed methane emissions -- including from seabed permafrost, shallow methane hydrate, and from thawing of either or both of these and increased gas migration pathways allowing free gas from underneath the hydrates to outgas.

(For full PowerPoint PDF, scroll down to Topic/Title Methane Release from Eastern Siberian Shelf.)

7. This increase in seabed permafrost thawing leads to a subsequent increased risk that a random seismic event could suddenly release large amounts of methane from the above combination of thawing sources, or from other thawed arctic carbon stores (see PowerPoint above).

8. Increased risk of general degradation of shallow methane hydrates leading to slope failure and consequent methane release.

9. Certain increase in chronic emissions of methane (and CO2) from thawing land permafrost, peat, etc. with the general added warming mentioned above.

10. The increased arctic methane lifetime (2.) is indistinguishable from an increase in its arctic abundance.

11. Increasing continued rate of ice (and snow) loss as the ice-free-period subsequently lengthens, from all the above, particularly significant as the insolation increases earlier in the season to around the solstice in June (discussion here, scroll down to An Ice-free Solstice).

And here are some immediate potential global impacts to chew on:

12. Recent research suggests that ice (and snow cover) loss is at least one causative factor in recentextreme weather -- drought, flood, fires, etc. -- and if so this could quickly be amplified.

13. Consequently, recent global impacts on food security could increase proportionally.

14. Economic losses from each of those (12., 13) would probably increase proportionally, and potentially could amplify into global economic recession or even depression.

15. If there's large-scale (multi gigaton-scale) methane release soon, this would of course fundamentally alter the whole path of global warming (see my Twilight posts #1,#2), with vast consequences.

16. If the ice-free period expands significantly, altered arctic tropospheric oxidation could rapidly start to impact high latitude urban areas, making cities with large populations rapidly become more difficult to live in (good discussion here at GISS, where Hansen is himself director).

No one said a word at the Greenpeace meeting, seemingly dismissing it as a major threshold at all. No one ever said, "Let's fight this." But I am suggesting that you should see skull and crossbones hanging above this threshold crossing. Like playing around high voltage wires or train tracks, allowing this threshold to be crossed will add considerable risk. And I'm suggesting that it will be crossed in just the next few years, unless we do something about it.

As I'll discuss next time, it might prove much harder to reverse than many assume within the climate world. Therefore, as Energy Secretary Steven Chu said about allowing an eventual runaway arctic permafrost carbon feedback, we must all say loudly now about this initial step onto that vast and treacherous slippery slope: "We cannot go there!" And if we don't want to go there, there's now no longer any question -- geoengineering will have to be part of the remedy.

[First posted at the Huffington Post; posted with author's permission]

Saturday, September 22, 2012

Professor Peter Wadhams calls for action

In the Youtube video below, Professor Peter Wadhams, Professor of Ocean Physics and Head of the Polar Ocean Physics Group of the University of Cambridge and one of the world's top sea-ice experts, joins The Big Picture, a show with Thom Hartmann filmed live and broadcast from the RT America studios in Washington DC.

Professor Wadhams warns that the Arctic sea ice looks set to be completely melted in just a few years. Professor Wadhams adds that action is needed that includes not only emissions cuts, but also geoengineering methods.

It was a Skype connection, so the sound quality was not optimal, but Peter Carter has improved this in the version below. Anyway, the message is important enough to be watched closely and to be further shared and discussed.


The diagram below illustrates this further.

more on this diagram

As the Arctic sea ice retreats, an ever smaller area remains in summer. Snow cover on the ice reflects between 80% and 90% of sunlight, while the dark ocean without ice cover reflects only 7% of the light, explains Stephen Hudson of the Norwegian Polar Institute. As the sea ice cover decreases, less solar radiation is reflected away from the surface of the Earth in a feedback effect that causes more heat to be absorbed and consequently melting to occur faster still.

The image below shows the retreat in September 2012 to date, compared with 7 other recent years.

credit: Arctic Sea Ice Blog
The image below further illustrates the rate at which Arctic sea ice is declining, and thus losing  its reflectivity.

Image produced by Peter Carter based on NSIDC images, showing the now exposed permafrost areas that extend from the continents into the shallow parts of the Arctic Ocean. 

NASA images showing the difference between sea ice cover between 1980 and 2012.

If you like, read more about this at the post Albedo change in the Arctic.

Wednesday, September 12, 2012

An accounting is now due

By Nathan Currier

Arctic Crisis: Far From Sight,
the Top of the World's Problems

Nathan Currier, senior climate advisor for Public Policy Virginia

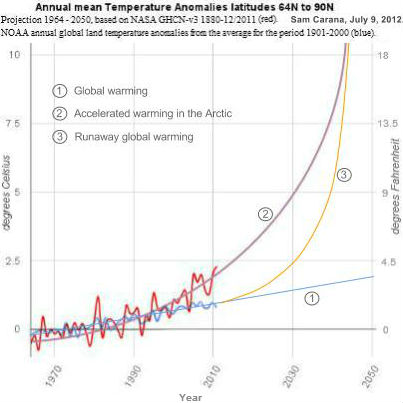
As this year's sea ice extent bottoms out, it's high time that more people recognize we're in a global crisis -- the Arctic crisis. I'm sorry if this sounds “alarmist”, but the Arctic, fundamental to the stability of our weather patterns, climate and agriculture, is rapidly coming apart. In the end, of course, this will just be a sub-plot to the bigger drama, the climate crisis, but by naming this the arctic crisis, I am suggesting that it needs to be treated independently, right away. It is the heart of the near-term climate issue, and its outcome could greatly alter the outcome of the larger story, which will be the saga of the century no matter what we do.

A crisis above all means this: a compression of time. In a medical crisis, for example, we expect that there will initially be the need to regain stability through some immediate means, and then other courses of treatment will be added subsequently to address the underlying problems. If the initial steps are not taken quickly enough, the whole trajectory can be different, rendering something quite manageable more dire, potentially even fatal. Because the arctic, which has received the brunt of warming, seems poised to pass a profound state shift in the very near future (in fact it's already underway), and because it offers such vital 'services' to the planet, one could say that the urgency of the larger climate crisis is for the time being mostly contained within this arctic crisis.

But before looking at what to do, or even describing what's at stake, there's another order of business to turn to. An accounting is now due. Today I want to look back at the most authoritative recent opinions suggesting that this isn't a crisis, and see how they've been holding up. In our pre-election season of fact-checking, let's call this the 'Arctic crisis debate' fact-checking 101. But since no one else has really been referring to an Arctic crisis, what we'll be looking at are some prominent statements from 2012 concerning the two great interrelated features of arctic stability: the state of its cryosphere, and the state of its carbon stocks. In particular, the sea ice and methane.

An accounting
is now due! 

When I last wrote, it was after a flurry of methane articles, including the front page New York Times article last December on the danger of increasing arctic methane emissions, followed by David Archer's curious Much Ado about Methane piece in RealClimate, the leading climate science blog. That article put strangeness into high gear by essentially discounting the value of near-term climate altogether. But Much Ado about Methane was valuable, too, in that Archer unwittingly demonstrated, with all his authority, just how far from 'Nothing' reasonably likely arctic methane releases could be. Archer provided a graph in his follow-up showing the radiative impact of a 10Gt release, only about 20% of what leading researchers of the Eastern Siberian Shelf (ESAS) think could potentially come from that region alone in the relatively near future. [Very little methane hydrate need be involved, incidentally: imagine some seismic event there, where a little shallow hydrate, a mere .05% of the hydrate there, gets released, destabilizing just .5% of the permafrost cap along with it, which gets metabolized to methane, and all this creates increased gas migration pathways for just 1% of the free gas from below -- that's 10Gt.] Radiative forcing, the measure scientists use to describe global warming, would jump globally to about 300% of its current level of increase since industrialization, and this would begin to express itself in the climate system almost right away. Much ado, indeed: that methane wouldn't be nothing.

In my last piece, I said I would quickly follow up with another one discussing what should be done to avoid such dangers, but have since remained silent. That's for a variety of reasons, one of them being a growing involvement with a group based in the UK called the Arctic Methane Emergency Group (AMEG), focused on just this question. And almost as soon as this began, RealClimate published a piece on arctic sea ice predictions, in which AMEG -- which has projected that summer sea ice could approach an ice-free minimum just a few years from now -- seemed a primary target.

Called Arctic Sea Ice Volume: PIOMAS, Prediction and the Perils of Extrapolation, it was written by a guest, Axel Schweiger (with Ron Lindsay and Cecilia Bitz), part of the team that runs the PIOMAS sea ice model at the Polar Science Center. The 'perils' it discussed were those of AMEG's use (or misuse) of their PIOMAS model, and some of us were actually flattered that our ragtag army of citizen scientists, along with a few major climate figures willing to brave academic censure for taking positions outside the status quo, like renowned sea ice expert Peter Wadhams, were receiving cannonballs lobbed from the heart of the climate establishment.

Now, it's almost a half year later, the sea ice minimum is upon us, and the ice has been doing just what AMEG predicted. As Neven Acropolis, who runs the Sea Ice Blog, wrote last week, he's particularly at a loss for words because the 2007 record has been shattered without this summer's arctic temperatures being particularly conducive to such large ice loss, which perhaps suggests something about the extraordinary underlying nature of what is taking place.

Meanwhile, AMEG had already presented its case, both in writing and orally, before a panel of the UK Parliament, on both sea ice and methane release, back at the beginning of the year. AMEG's testimony was rebutted by Julia Slingo, Chief Scientist for the UK Met Office. Now, how has this Met Office testimony held up since?

Unlike RealClimate, the Met Office chief scientist dismissed PIOMAS modeling altogether, saying that she expected better data, fitting their Hadley Center climate models, to come in soon. That data hasn't come. Far from it. Instead, just last month, the media was filled with news pieces about how the European Space Agency's new CryoSat-2, a satellite designed to read ice volume, showed far greater volume losses than expected -- much in line with PIOMAS modeling, and supportive of AMEG's position. Near the opening of her testimony, Prof. Slingo said that the 2007 melting event was really an advecting of ice, coming from extreme weather over the arctic, and not really a melting event per se. Of course, we have just noted how that 2007 record has now been widely surpassed, without such weather (nor with losses coming primarily from advection).

And when it came to methane, and the danger of releases from the arctic seabed, the UK Met Office's chief scientist said: “I think there is a lack of clarity in thinking about how that heating at the upper level of the ocean can get down, and how rapidly it can get down into the layers of the ocean.”

The Great Arctic Cyclone of 2012 has perhaps provided her with a little more clarity. Beyond that, the Chief Scientist's statement was embarrassing: after all, even those most convinced that there is little danger of large immediate methane releases do not doubt the well established and drastic warming of the sea bottom precisely in the most methane-rich areas (see this paper), and Lena river discharge also greatly impacts the seabed in some of this same region, providing yet another mechanism for seabed warming. Prof. Slingo said: At the moment, our estimates are that the increases in sea floor temperatures that have been observed have at the most been about one-tenth of a degree, except in one or two regions, like the West Spitsbergen Current.

Clearly, Prof. Slingo doesn't seem to have studied the ESAS, where anomolies of 5ºC at the seabed have been recorded, where almost all of it has warmed some 20 times more than she says (and is still currently warming, ten times more than she suggests per decade), where significant areas of permafrost cap are thawing or already thawed, and where methane is starting to be released (see my own last post on all these points). Unlike the phony “Climategate” scandal, this is a true embarrassment for climate science. And if such “expert” testimony helps the arctic climate to pass through some invisible gate without our society lifting a finger to stop it, it will also turn out to have been one of the greatest tragedies of modern times.

So, how now, for the ice and methane? Schweiger's Perils of Extrapolation piece clearly stated how PIOMAS shows September sea ice volumes having dropped by a breathtaking 75% over just the last few decades (1979-2011). It might even seem simple to deduce that ice-free minima would be arriving quite soon, given this. But it is, I would agree, a vastly complex situation. Fully coupled models - those that do not, like PIOMAS, leave out the atmosphere, the weather, etc., but that try to create a realistic world that can be run into the future -- almost all suggest an eventual dampening effect on the underlying feedbacks leading to ice loss once it is mostly gone, thus leading to a long 'tail' of one or more decades in which a small amount of thinner summer ice remains, rather than an imminent disappearance, as both AMEG's Peter Wadhams and Wieslaw Maslowski, whose work Gore cited in his 2007 Nobel speech, have suggested.

That dampening, however, isn't happening. One almost feels sorry for Gavin Schmidt at RealClimate these days. After their latest sea ice update, he repeated in its comment thread how there is no reason to extrapolate PIOMAS into the future using an exponential curve (which shows a collapse just a few years from now). RealClimate wants to deal with the real underlying physical mechanisms involved, not just take some simple line that best fits the ice's past behavior and then extrapolate that line into the future. But, darn! The newest PIOMAS data have just been released last week, and, again, that exponential curve is being eerily followed by the real world's sea ice! In fact, Wieslaw Maslowski has also developed a new model recently, a fully coupled model free from 'perilous extrapolations,' which shows much the same thing as his prior research -- that a summer sea ice collapse is likely in the coming years, not decades.

As you can see, the reasons for thinking that there isn't an arctic crisis are about as firm as cotton candy. Next you'll need to learn the more solid reasons for suspecting that there is one. Then, after that, the big questions -- What real climate perils could this entail? What should we be doing about it right now? -- are what one needs to turn to next.

[First posted at the Huffington Post; posted with author's permission]

Wednesday, September 5, 2012

Arctic sea ice loss is effectively doubling mankind's contribution to global warming

Loss of Arctic sea ice is effectively doubling mankind's contribution to global warming. Increased absorption of the sun's rays is "the equivalent of about 20 years of additional CO2 being added by man", Professor Peter Wadhams said in the BBC article: Arctic ice melt 'like adding 20 years of CO2 emissions', by Susan Watts, September 5, 2012.

For more details on Professor Wadhams' calculations, see the earlier post Albedo change in the Arctic.

Arctic sea ice area fell by 11.33629 million square km from March 28, 2012, to September 1, 2012, as shown on the image below, edited from The Cryosphere Today. That's an 82.7 percent fall in 157 days. 


The image below shows Arctic sea ice extent (total area of at least 15% ice concentration) for the last 7 years, compared to the average 1972-2011, as calculated by the Polar View team at the University of Bremen, Germany.

There still are quite a few days to go in the melting season, so the fall could be even more dramatic.

Peter Wadhams adds:  “The point about summer conditions is that as long as there is SOME ice present on the sea surface, however thin the layer, then the ocean temperature below it is held to 0 degrees Celsius because the absorbed solar radiation melts the ice rather than warming the water. Also the atmospheric temperature is held to close to 0 degrees Celsius because warmer air melts the surface snow layer on top of the ice and is thereby cooled. The sea ice, even when thinned, continues to act with 100% efficiency as an air conditioning system for ocean and atmosphere alike.”

“BUT”, Prof Wadhams continues, “as soon as the sea ice layer goes, this process ceases and the sea can warm up rapidly (to typically 7 degrees Celsius by the end of summer - which is not much colder than the North Sea), as can the atmosphere (which speeds up Greenland ice sheet melt when that warmed air passes over Greenland). Latent heat is an enormously powerful buffer - the amount of heat that you have to pump in to melt 1 kg of ice will subsequently heat that same amount of melted water to 80 degrees Celsius. So once the ice goes away entirely there is a big jump in temperatures in the upper ocean and atmosphere (with dire consequences for permafrost), and it is very difficult to see how one can ever go back to an ice-covered summer ocean once this has happened.”

In the August 27, 2012, BBC article Arctic sea ice reaches record low, Nasa says, by Roger Harrabin, Professor Peter Wadhams said: “Implications are serious: the increased open water lowers the average albedo [reflectivity] of the planet, accelerating global warming; and we are also finding the open water causing seabed permafrost to melt, releasing large amounts of methane, a powerful greenhouse gas, to the atmosphere.”

Indeed, there is a danger that loss of the sea ice will weaken the currents that currently cool the bottom of the sea, where huge amounts of methane may be present in the form of free gas or hydrates in sediments. This danger is illustrated by the image below by Reg Morrison.


The image below, from a study by Polyakov et al., shows temperature differences in the vertical water column at selected stretches of water in the Arctic over the years.

[click images to enlarge]


Thursday, August 16, 2012

CryoSat


The image below shows how much the older, thicker sea ice has declined over the years. This decline doesn't become apparent when focusing on sea ice extent; volume measurements are needed to reveal this decline.

Old versus new ice in Arctic: The maps show the median age of sea ice in March 1985 (left) and March 2011 (right).
Overall, the proportion of old ice has decreased. By March 2011, ice over 4 years old accounts for less than
10% of the Arctic ice cover. Credit: National Snow and Ice Data Center, University of Colorado, Boulder.
The screenshot below shows GHRSST volume measurements from National Centre for Ocean Forecasting website.


The European Space Agency's CryoSat promises to deliver an even clearer picture. One of the scientists analyzing the CryoSat data, Dr Seymour Laxon, said in April 2012 that CryoSat's volume estimate is very similar to that of PIOMAS, the model developed at the Polar Science Center at the University of Washington.

In a recent interview, Dr Laxon said that if the current trend continues, the Arctic could be ice-free at the height of summer by the end of the decade.

John Nissen, Chair of the Arctic Methane Emergency Group (AMEG), comments: "Dr Laxon failed to mention the data on sea ice thickness that has been collected over many years by sea ice expert Professor Peter Wadhams of the University of Cambridge, who now considers that the Arctic Ocean will be seasonally free of sea ice most probably by September 2016. PIOMAS sea ice volume data suggest that a collapse in sea ice area could occur even sooner, as discussed on the AMEG blog posting."

Monday, August 13, 2012

Getting the picture

Have a look at the picture below. It shows a graph based on data calculated by the Pan-Arctic Ice Ocean Modeling and Assimilation System (PIOMAS) developed at the Applied Physics Laboratory/Polar Science Center at the University of Washington.
image from arctische pinguin - click to enlarge
The PIOMAS data for the annual minimum values are the black dots. The trend (in red) is added by Wipneus and points at 2015 as the year when ice volume will reach zero. Note that the red line points at the start of the year 2015. The minimum in September 2014 will be already be close to zero, with perhaps a few hundred cubic km remaining just north of Greenland and Canada.
image from arctische pinguin - click to enlarge
Above image, again based on PIOMAS data, shows trends added by Wipneus for each month of the year. The black line shows that the average for the month September looks set to reach zero a few months into the year 2015, while the average for October (purple line) will reach zero before the start of the year 2016. Similarly, the average for August (red line) looks set to reach zero before the start of the year 2016.

In conclusion, it looks like there will be no sea ice from August 2015 through to October 2015, while a further three months look set to reach zero in 2017, 2018 and 2019 (respectively July, November and June). Before the start of the year 2020, in other words, there will be zero sea ice for the six months from June through to November.

Actually, events may unfold even more rapidly. As the ice gets thinner, it becomes more prone to break up if there are storms. At the same time, the frequency and intensity of storms looks set to increase as temperatures rise and as there will be more open water in the Arctic Ocean.


Above photo features Peter Wadhams, professor of Ocean Physics, and Head of the Polar Ocean Physics Group in the Department of Applied Mathematics and Theoretical Physics, University of Cambridge. Professor Wadhams has been measuring the sea ice in the Arctic for the 40 years, getting underneath the ice with the assistance of submarines, collecting ice thickness data and monitoring the thinning of the ice. This enabled 1970s data and 1980s data to be compared, which showed that the ice had thinned by about 15%. Satellite measurements only started in 1979.

Thinning of the ice is only one of the problems. "The next stage will be a collapse," Professor Wadhams warns, "where the winter growth is more than offset by the summer melt. If we look at the volume of ice that is present in the summer, the trend is so rapidly downwards that this collapse might happen within three or four years."

Apart from melting, strong winds can also influence sea ice extent, as happened in 2007 when much ice was driven across the Arctic Ocean by southerly winds. The fact that this occurred can only lead us to conclude that this could happen again. Natural variability offers no reason to rule out such a collapse, since natural variability works both ways, it could bring about such a collapse either earlier or later than models indicate.

In fact, the thinner the sea ice gets, the more likely an early collapse is to occur. It is accepted science that global warming will increase the intensity of extreme weather events, so more heavy winds and more intense storms can be expected to increasingly break up the remaining ice, both mechanically and by enhancing ocean heat transfer to the under-ice surface.

Recent events in the Arctic underline this warning. A huge cyclone battered the sea ice early August 2012. The image below, from The Cryosphere Today, shows a retreat in sea ice area to 3.09958 million km2 on the 222nd day of 2012, down from 3.91533 million km2 on the 212th day of 2012, i.e. 815,750 km2 less in ten days. Or, more than one-fifth less in just ten days.

Image from  The Cryosphere Today - click to enlarge

Friday, July 6, 2012

Albedo change in the Arctic

Albedo change: Snow cover on the ice reflects between 80% and 90% of sunlight, while the dark ocean without ice cover reflects only 7% of the light, explains Stephen Hudson of the Norwegian Polar Institute. As the sea ice cover decreases, less solar radiation is reflected away from the surface of the Earth in a feedback effect that causes more heat to be absorbed and consequently melting to occur faster still.

Arctic sea ice volumes keep falling. The image below is from the Polar Science Center's Pan-Arctic Ice Ocean Modeling and Assimilation System (PIOMAS, Zhang and Rothrock, 2003).


Wednesday, June 27, 2012

When the sea ice is gone


How long do you think it will take for most sea ice in the Arctic to disappear? How much change in temperature you think this would result in? 

Below an educated guess from some of the members of the Arctic Methane Emergency Group

Professor Peter Wadhams
Peter Wadhams Sc.D., Professor of Ocean Physics
and head of the Polar Ocean Physics group at the
University 
of Cambridge, U.K., researching effects
of global warming 
on sea ice, icebergs and oceans


My own view of what will happen is:
  1. Summer sea ice disappears, except perhaps for small multiyear remnant north of Greenland and Ellesmere Island, by 2015-16.
  2. By 2020 the ice free season lasts at least a month and by 2030 has extended to 3 months.
  3. September sea surface temperatures are already elevated by 6-7°C over continental shelves of Arctic. As shrink back continues, the newly exposed surface water over abyssal depths warms up less in a single summer (say 2-3°C) because of deeper surface water layer (150 m) than over a shelf (50 m).
  4. The 6-7°C warming over the shelves causes offshore permafrost to shrink back and vanish over about 10 years. During this time there is elevated methane emission from offshore and from onshore warming, and global warming rates increase by about 50%.
  5. Result is that bad effects forecast for end of century (4°C warming worldwide, 10°C in Arctic) actually occur by about 2060. Speed of change is catastrophic for agriculture; warfare and population crashes ensue.
  6. Late in the day, the rapidly disintegrating civilised world tries desperate technofixes for warming and resource depletion, e.g. widespread use of nuclear power (thorium cycle), geoengineering. This may work, and bring us back from the brink of destruction after heavy losses.

Paul Beckwith
Paul Beckwith, B.Eng, M.Sc. (Physics),
Ph. D. student (Climatology) and
Part-time Professor, University of Ottawa

My projections for our planet conditions when the sea-ice has all vanished year round (PIOMAS graph projects about 2024 for this; I forecast 2020 for this) are:
  • Average global temperature: 22°C (+/- 1°C)
    (rise of 6-8°C above present day value of about 15°C)
  • Average equatorial temperature: 32°C
    (rise of 2 °C above present day value of 30°C)
  • Average Arctic pole temperature: 10°C
    (rise of 30°C above present day value of -20°C)
  • Average Antarctica pole temperature: -46°C
    (rise of 4°C above present day value of -50°C)
  • Water vapor in atmosphere: higher by 50%
    (rise of 4% over last 30 years, i.e. about 1.33% rise per decade)
  • Average temperature gradient from equator to North pole: 22°C
    (decrease of 28°C versus present day value of 50°C)
  • Very weak jet streams (driven by N-S humidity gradient and weak temperature gradient as opposed to existing large temperature gradient)
- Result: very fragmented, disjointed weather systems
- Basic weather: tropical rainforest like in some regions; arid deserts in others with few regions in between

Note: This scenario would require significant emissions of methane from the Arctic. Without this methane, the scenario would still occur but would take longer. Disclaimer: Best guess and subject to rolling revisions!


Peter Carter
Dr. Peter Carter, MD, Canada
climate-emergency-institute.org

If methane is the main driver of natural end glacial warming rather than carbon dioxide, projections of global temperature increases are out by orders of magnitude.

On sea ice:
According to Tim Lenton’s opinion that 2007 was the tipping point, the start of ice free summers would begin @2015 on a new linear trajectory. As we know the trajectory is not linear, it would probably be earlier. As most of the models project possible abrupt loss, I assume it could be any year now.

Whatever the additional warming may be [because of already unavoidable committed warming], the multiple cascading Arctic positive feedback domino effect is already unstoppable except by cooling. 


Sam Carana

Already now, temperature rises and levels of greenhouse gases are higher in the Arctic than elsewhere. The prospect is that we'll lose most sea ice within a few years, resulting in a lot more sunlight to be absorbed, adding to the temperature rise in the Arctic. 

This would push up Arctic temperatures by over 10°C within a few decades, but in some places such rises could occur in a matter of years, rather than decades

Most worrying is that such intense local warming in the Arctic can cause large abrupt methane releases from sediments. This would add a lot of additional warming that would result in massive crop losses globally, threatening global fresh water supply and causing extinction at massive scale. 

Clearly, action must be taken to reduce the danger that this will eventuate.


John Nissen 

John Nissen, MA (Cantab) Natural Sciences, 
Director of Cloudworld Ltd, U.K., Chair of
Arctic Methane Emergency Group (AMEG)
Of late, I have been basing my estimates of Arctic warming on a current rate of 1 degree per decade, doubling after sea ice collapse, and doubling again when ice is gone for five or six months of the year. Looking at PIOMAS data, I think we can safely assume 2015 for the first doubling, and around 2020 for the second doubling. This means that between 2015 and 2020, the rate would be 2°C per decade, i.e. 1°C per 5 years. After that, it would double to 4°C per decade, up to 2030. That gives 5°C warming over 15 years.

I am now wondering whether 1°C per decade is too small, since Peter says that the water has warmed 6-7°C. However 1°C per decade is already at least 5x global warming, reckoned to be at less or equal to 0.2°C per decade.

If today, there has been 0.8°C global warming temperature rise, then, by 2030, global warming will be around 1.2°C, neglecting methane and Arctic warming. If we take Flanner's higher figure of ~4 W/m2 increase, for the Northern Hemisphere, when sea ice has gone, then that is ~2 W/m2, globally. According to Hansen net the current net forcing imbalance is under 1 W/m2, producing the 0.2°C per decade, and nearly 1.0 degree global warming temperature rise by 2020. With complete loss of snow and ice, we'd only be doubling the global warming rate. Suppose we double the rate from 2020 to 2030, then the global warming temperature rise would be around 1.4°C by 2030.

A temperature rise of 1.4°C doesn't seem too bad, but then we have the disruptive effect of the Arctic warming disrupting the NH weather systems. This is already having a serious effect, so could be pretty catastrophic by 2020, let alone 2030.

Now we add in the methane, and there's more uncertainty, except things are going to be worse, and could be a lot worse, especially if that 50 Gt of methane comes out of ESAS this decade. That could send global forcing up to around 9W/m2 (averaged over 20 years?), and warming rate up to 2°C per decade, giving us over 3°C global warming temperature rise by 2030 in the worst case. So we'd be well beyond the so-called safety limit of 2°C!

I agree with Peter that some dramatic increase in methane emission is inevitable, so my conservative estimate would be an additional 400 Mt per year by 2020. This would nearly double the methane forcing by 2030, from current 1W/m2 (including indirect effects) to around 2W/m2. This would add a temperature rise of 0.1°C, taking the total from 1.4 to 1.5°C.

So my conclusion on global warming temperature rise is between 1.5°C and 3°C by 2030, while the Arctic warms at least 5°C above current temperatures. We must not go there! Geoengineering is essential!

BTW, the warming in the Arctic would guarantee collapse of the Greenland Ice Sheet this century, adding ~7 metre sea level rise and probably triggering the collapse of the WAIS adding a further 7 metres or so.


 Douglas Spence - Software Engineer,
interested party and concerned citizen 
Douglas Spence 

Now

1. Even with the Arctic ice in the present state increasingly extreme weather is already moving us closer to a point of increasing risk to agricultural output.

2. For the last few years extreme weather has worsened year on year and since we have positive feedback processes in progress we have no reason to suppose this will do anything but accelerate rapidly.

2012-13

3. I expect significant to majority sea ice loss to occur in either 2012 or 2013, and expect this to dramatically worsen the weather, causing immediate stress to global food supplies. Combined with weak economic conditions we will see stress in countries dependent on food imports or aid triggering more "Arab spring" moments in previously stable regimes. Movement of refugees will cause knock on effects in neighbouring regions.

4. Modern civilisation is fragile and dependent on global supply chains that can be disrupted both by weather and politics. We will experience an increasing incidence of problems maintaining normal operation in technologically advanced societies. There is the potential for conflict in the Arctic as new resources open up.

5. Other positive feedbacks such as methane release and forest burn off will accelerate.

2014-15

6. I expect total sea ice loss will occur during summer in either 2014 or 2015. By this time I expect agricultural output to have declined to a point where food supplies are inadequate and famine and conflict are rife. Farmers will not know what to plant or when and even acquiring seed from other climatic regions may be problematic.

7. Social conditions will be comparable to the Holomodor. People will try to eat anything and everything - earthworms, insects, each other - even in some cases their own children. Nation states will fragment and reform into smaller and increasingly violent competitive groups fighting over rapidly diminishing resources. Maintaining the supply chains required for the operation of modern technology including agriculture will be largely impossible.

8. If we see widespread war before nation states fragment there is a possibility of the use of nuclear and genetically enhanced biological weaponry. Whether through war or famine the human population will be in freefall.

2016+

9. The climate will continue to worsen as more heat flows into the system and this will become the new threat to survivors as population density becomes too low to sustain conflict. Most survivors will be eliminated, leaving the human race on the brink of extinction. A majority of the planet will cease to be habitable. The deserts will greatly expand, though this will help balance the planets thermal budget. Very few people will live to see the Arctic sea ice entirely gone throughout the year or the ruined cities drowned in the rising sea.

10. Assuming the collapse is as rapid and severe as I expect – I would expect the human population to collapse below the new carrying capacity of the planet and therefore for resource pressure to lighten once a sufficient number of people die (granted with few useful resources left and uncertainty about precisely which regions would be good prospects).

Finally

Theoretically there will be some isolated and scattered areas where the climate is still habitable, resources are sufficient and some form of agriculture can be practised. If small groups of people make it to these areas, there is a theoretical chance over many generations to recover civilisation, albeit at great disadvantage.

Disaster taxa will rapidly proliferate into the empty ecosystem, leaving the return of biodiversity to occur over a few million years, bringing the sixth great mass extinction to a close.

NB Since we are at a point where weather is a key effect, allow +/- 1 year for (good/bad) luck.


Malcolm Light
Malcolm Light, PhD, University of London
Earth science consultant


If left alone the subsea Arctic methane hydrates will explosively destabilize on their own due to global warming and produce a massive Arctic wide methane “blowout” that will lead to humanity’s total extinction,  probably before the middle of this century. AIRS atmospheric methane concentration data between 2008 and 2012 (Yurganov 2012) show that the Arctic has already entered the early stages of a subsea methane “blowout” so we need to step in as soon as we can (e.g 2015) to prevent it escalating any further.

The Arctic Natural Gas Extraction, Liquefaction & Sales (ANGELS) Proposal aims to reduce the threat of large, abrupt releases of methane in the Arctic, by extracting methane from Arctic methane hydrates prone to destabilization.

After the Arctic sea ice has gone (probably around 2015) we propose that a large consortium of oil and gas companies/governments set up drilling platforms near the regions of maximum subsea methane emissions and drill a whole series of shallow directional production drill holes into the subsea subpermafost “free methane” reservoir in order to depressurize it in a controlled manner. This methane will be produced to the surface, liquefied, stored and transported on LNG tankers as a “green energy” source to all nations, totally replacing oil and coal as the major energy source. The subsea methane reserves are so large that they can supply the entire earth’s energy needs for several hundreds of years. By sufficiently depressurizing the Arctic subsea subpermafrost methane it will be possible to draw down Arctic ocean water through the old eruption sites and fracture systems and destabilize the methane hydrates in a controlled way thus shutting down the entire Arctic subsea methane blowout.


Sunday, April 29, 2012

Supplementary evidence by Prof. Peter Wadhams

Supplementary written evidence 
submitted by Professor Peter Wadhams 
to the Environmental Audit Committee (EAC)
I am writing in response to information provided recently by Professor Julia Slingo OBE, Chief Scientist, Meteorological Office, firstly in the report 'Possibility and Impact of Rapid Climate Change in the Arctic' to the Environmental Audit Committee and subsequently in answering questions from the Committee on Wednesday 14 March 2012. In the responses, the Meteorological Office refers to an earlier presentation to the Committee by myself, made on 21 February 2012.
The following comments are based on the uncorrected transcript of Professor Slingo’s presentation to the EAC, 14 March 2012 session, as at: 
http://www.publications.parliament.uk/pa/cm201012/cmselect/cmenvaud/uc1739-iv/uc173901.htm
1. Speed of ice loss
In response to questions from the Chair, Prof. Slingo ruled out an ice-free summer by as early as 2015. Furthermore, Prof. Slingo rejected data which shows a decline in Arctic sea ice volume of 75% and also rejected the possibility that further decreases may cause an immediate collapse of ice cover.
The data that Prof. Slingo rejected are part of PIOMAS, which is held in high regard, not only by me, but also by many experts in the field. From my position of somebody who has studied the Arctic for many years and has been actively participating in submarine measurements of the Arctic ice thickness since 1976, it seems extraordinary to me that for Prof. Slingo can effectively rule out these PIOMAS data in her consideration of the evidence for decreasing ice volume, when one considers the vast effort and diligence that has been invested over such an extended period in collecting data under the ice by both British and US scientists. Prof. Slingo offers no reason whatsoever for dismissing this extremely pertinent set of measurements and their associated interpretation, arguing that "the observational estimates are still very uncertain". This is not the case. I expand on this in an Appendix to my letter.
It has to be said that it is very poor scientific practice to reject in such a cavalier fashion any source of data that has been gathered according to accepted high scientific standards and published in numerous papers in high-profile journals such as Nature and Journal of Geophysical Research, the more so when the sole reason for this rejection appears to be perceived uncertainty. If other data are in conflict with one’s own data, then caution should be given to the validity of one’s own data, while this should immediately set in train further research and measurement in efforts to resolve possible conflicts. In this case, however, the crucial point is that there is currently no rival set of data to compare with the scale and comprehensiveness of the PIOMAS data; Prof. Slingo sets against the clear observational database only the Met. Office’s models. These models (and in fact all the models used by IPCC) have already shown themselves to be inadequate in that they failed to predict the rapid decline in sea ice area which has occurred in recent years. It is absurd in such a case to prefer the predictions of failed models to an obvious near-term extrapolation based on observed and measured trends.
Regarding the possibility of an imminent collapse of sea ice, Prof. Slingo ignores a point raised earlier by herself, i.e. that, apart from melting, strong winds can also influence sea ice extent, as happened in 2007 when much ice was driven across the Arctic Ocean by southerly winds (not northerly, as she stated). The fact that this occurred can only lead us to conclude that this could happen again. Natural variability offers no reason to rule out such a collapse, since natural variability works both ways, it could bring about such a collapse either earlier or later than models indicate.
In fact, the thinner the sea ice gets, the more likely an early collapse is to occur. It is accepted science that global warming will increase the intensity of extreme weather events, so more heavy winds and more intense storms can be expected to increasingly break up the remaining ice, both mechanically and by enhancing ocean heat transfer to the under-ice surface.
The concluding observation I have to make on this first point is that Prof. Slingo has not provided any justification for ignoring the measurements that we have of ice volume changes and the clear trend towards imminent ice-free summers that they indicate.
2. Methane – potential emissions and escalation
My second point of contention is Prof. Slingo’s position on the possibility of imminent large releases of methane in the Arctic, which is consistent with her sanguine attitude to the rate of loss of ice cover. She states "Our estimates of those (large releases of methane) are that we are not looking at catastrophic releases of methane." Prof Slingo suggests that there was "a lack of clarity in thinking about how that heating at the upper level of the ocean can get down, and how rapidly it can get down into the deeper layers of the ocean". This appears to show a lack of understanding of the well-known process of ocean mixing. As Prof. Slingo earlier brought up herself, strong winds can cause mixing of the vertical water column, bringing heat down to the seabed, especially so in the shallow waters of the East Siberian Arctic Shelf. A recent paper shows that "data obtained in the ESAS during the drilling expedition of 2011 showed no frozen sediments at all within the 53 m long drilling core" (Dr. Natalia Shakhova et al. in: EGU General Assembly 2012;
http://meetingorganizer.copernicus.org/EGU2012/EGU2012-3877-1.pdf ).
The East Siberian Arctic Shelf (ESAS), where the intensive seabed methane emissions have been recorded, is only about 50 m deep. Throughout the world ocean, the Mixed Layer (the near-surface layer where wind-induced mixing of water occurs) is typically 100-200 m deep. It is shallower only in areas where the water is extremely calm. This used to be the case for the Arctic Ocean because of its ice cover, but it is no longer the case, because of the large-scale summer sea ice retreat which has created a wide-open Beaufort Sea where storms can create waves as high as in any other ocean, which exert their full mixing effect on the waters. It is certain that a 50 m deep open shelf sea is mixed to the bottom, so I am at a loss to understand Prof. Slingo’s remarks, unless she is thinking of the deep ocean or deeper shelves elsewhere than the East Siberian Sea.
Furthermore, Prof. Slingo states that "where there is methane coming out of the continental shelf there it is not reaching the surface either, because again the methane is oxidised during its passage through the sea water and none of those plumes made it to the surface. So there is a general consensus that only a small fraction of methane, when it is released through this gradual process of warming of the continental shelf, actually reaches the surface." This statement is also incomprehensible as far as the East Siberian Arctic Shelf is concerned. With such a shallow water depth the methane plume reaches the surface within a few seconds of release, giving little opportunity for oxidation on the way up. She may be confusing this situation with that of the much deeper waters off Svalbard where methane plumes are indeed observed to peter out before reaching the surface, due to oxidation within the water column.
To illustrate the reality of this warming of ESAS shelf water, I reproduce (fig. 1) a satellite sea surface temperature data (SST) map from September 2011, provided by Dr James Overland of Pacific Marine Environmental Laboratory (PMEL), Seattle. This shows that in summer 2011 the surface water temperature in the open part of the Beaufort and Chukchi seas reached a massive 6-7°C over most of the region and up to 9°C along the Arctic coast of Alaska. This is warmer than the temperature of the North Sea at Scarborough yesterday. This extraordinary warming is due to absorption of solar radiation by the open water. These are not the temperatures of a very thin skin as suggested by Prof. Slingo. The NOAA data apply to the uppermost 7 m of the ocean, while PMEL has backup data from Wave Gliders (automatic vehicles that run oceanographic surveys at preprogrammed depths) to show that this warming extends to at least 20 m. We can conclude from fig.1 that an extraordinary seabed warming is taking place, certainly sufficient to cause rapid melt of offshore permafrost, and this must cause serious concern with respect to the danger of a large methane outbreak.
Once the methane reaches the surface, one should note that there is very little hydroxyl in the Arctic atmosphere to break down the methane, a situation that again becomes even worse with large releases of methane.
3. The choice of pursuing geo-engineering or not.
Finally, I would like to address Prof. Slingo’s closing remarks on geo-engineering.
Both Professor Slingo and Professor Lenton repeat a point made by many critics of geo-engineering that once you start geoengineering you have to continue. On this point, I like to draw attention to evidence earlier provided to the Environmental Audit Committee by Professor Stephen Salter, as can be found at
http://www.publications.parliament.uk/pa/cm201012/cmselect/cmenvaud/writev/1739/arc22.htm
Prof. Salter responds: "I must disagree. You have to continue only until emissions have fallen sufficiently or CO2 removal methods have proved effective or there is a collective world view that abrupt global warming is a good thing after all. No action by the geo-engineering community is impeding these. Indeed everyone working in the field hopes that geoengineering will never be needed but fears that it might be needed with the greatest urgency. This is like the view of people who hope and pray that houses will not catch fire and cars will not crash but still want emergency services to be well trained and well equipped with ambulances and fires engines." Basically he is talking about the precautionary principle.
I fully agree with Prof. Salter on this point, and I also fully share with Prof. Salter the anxieties of the Arctic Methane Emergency Group. A highly proactive geo-engineering research programme aimed at mitigating global warming is more rational than expecting the worst but not taking any action to avert it.
Peter Wadhams,
Professor of Ocean Physics,
Department of Applied Mathematics and Theoretical Physics (DAMTP),
University of Cambridge
Member of Arctic Methane Emergency Group; Review Editor for Intergovernmental Panel on Climate Change 5th Assessment (chapter 1).


FIG.1. September 12-13 2011. NOAA-6 and-7 imagery of sea surface temperature in Beaufort Sea (courtesy of J. Overland). Alaska is brown land mass in bottom half. Note 6-7°C temperatures (green) in west, over East Siberian Shelf, and up to 9°C (orange) along Alaskan coast.
Appendix. The scientific database for sea ice loss.
On a previous occasion (21 February) I testified to the Committee and showed them the results of submarine measurements of ic thickness combined with satellite observations of ice retreat. When these two datasets are combined , they demonstrate beyond doubt that the volume of sea ice in the Arctic has seriously diminished over the past 40 years, by about 75% in the case of the late summer volume. If this decline is extrapolated, then without the need for models (which have demonstrably failed to predict the rapid retreat of sea ice in the last few years) it can be easily seen that the summer sea ice will disappear by about 2016 (plus or minus about 3 years). It might be useful to summarise the history of research in this subject.
In her testimony Prof Slingo placed her faith in model predictions and in future data to come from satellites on thickness (presumably Cryosat-2, which has not yet produced any usable data on ice thickness). Yet since the 1950s US and British submarines have been regularly sailing to the Arctic (I have been doing it since 1976) and accurately measuring ice thickness in transects across that ocean. Her statement that "we do not know the ice thickness in the Arctic" is false. In 1990 I published the first evidence of ice thinning in the Arctic in Nature (Wadhams, 1990). At that stage it was a 15% thinning over the Eurasian Basin. Incorporating later data my group was able to demonstrate a 43% thinning by the late 1990s (Wadhams and Davis, 2000, 2001), and this was in exact agreement with observations made by Dr Drew Rothrock of the University of Washington, who has had the main responsibility for analyzing data from US submarines (Rothrock et al., 1999, 2003; Kwok and Rothrock, 2009) and who examined all the other sectors of the Arctic Ocean. In fact in his 2003 paper Rothrock showed that in every sector of the Arctic Ocean a substantial hickness loss had occurred in the preceding 20 years. Further thinning has since been demonstrated, e.g. see my latest paper on this (Wadhams et al., 2011). Among the foremost US researchers at present active on sea ice volume decline are Dr Ron Kwok of the NASA Jet Propulsion Laboratory and Dr Axel Schweiger of University of Washington (leader of the PIOMAS project), and these have both been moved to write to Prof Slingo expressing their surprise at her remarks deriding the scientific database.
Even if we only consider a 43% loss of mean thickness (which was documented as occurring up to 1999), the accompanying loss of area (30-40%) gives a volume loss of some 75%. Summer melt measurements made in 2007 in the Beaufort Sea by Perovich et al. (2008) showed 2 m of bottom melt. If these enhanced melt rates are applied to ice which is mainly first-year and which has itself suffered thinning through global warming, then it is clear that very soon we will be facing a collapse of the ice cover through summer melt being greater than winter growth. These observations do not just come from me but also from the PIOMAS project at the University of Washington (a programme to map volume change of sea ice led by Dr Rothrock himself and Dr Schweiger), the satellite-based work of Ron Kwok, and the high-resolution modelling work of Dr Wieslaw Maslowsky at the Naval Postgraduate School, Monterey (e.g. Maslowsky et al 2011).
References
Kwok, R., and D. A. Rothrock ( 2009 ), Decline in Arctic sea ice thickness from submarine and ICESat records: 1958- 2008,Geophys. Res. Lett ., 36, L15501.
Maslowsky, W., J. Haynes, R. Osinski, W Shaw (2011). The importance of oceanic forcing on Arctic sea ice melting. European Geophysical Union congress paper XY556. See also Proceedings, State of the Arctic 2010, NSIDC.
Perovich, D.K., J.A. Richter-Menge, K.F. Jones, and B. Light (2008). Sunlight, water, ice: Extreme Arctic sea ice melt during the summer of 2007. Geophysical Research Letters 35: L11501. doi: 10.1029/2008GL034007 .
Rothrock, D.A., Y. Yu, and G.A. Maykut. (1999). Thinning of the Arctic sea-ice cover . Geophysical Research Letters 26: 3469–3472.
Rothrock, D.A., J. Zhang, and Y. Yu. (2003). The arctic ice thickness anomaly of the 1990s: A consistent view from observations and models. Journal of Geophysical Research 108: 3083. doi: 10.1029/2001JC001208 .
Shakhova, N. and I. Semiletov (2012). Methane release from the East-Siberian Arctic Shelf and its connection with permafrost and hydrate destabilization: First results and potential future development. Geophys. Res., Vol. 14, EGU2012-3877-1.
Wadhams, P. (1990). Evidence for thinning of the Arctic ice cover north of Greenland. Nature 345: 795–797.
Wadhams, P., and N.R. Davis. (2000). Further evidence of ice thinning in the Arctic Ocean. Geophysical Research Letters 27: 3973–3975.
Wadhams, P., and N.R. Davis (2001). Arctic sea-ice morphological characteristics in summer 1996. Annals of Glaciology 33: 165–170.
Wadhams, P., N Hughes and J Rodrigues (2011). Arctic sea ice thickness characteristics in winter 2004 and 2007 from submarine sonar transects. J. Geophys. Res., 116, C00E02.